








Reporting and monitoring

Know what your ads earn, and hear about problems before they cost you

One dashboard shows revenue across all your sites by format and device. Behind it, our AdOps team checks every demand partner on every domain each morning and acts on what changed, before it shows up in your monthly numbers.

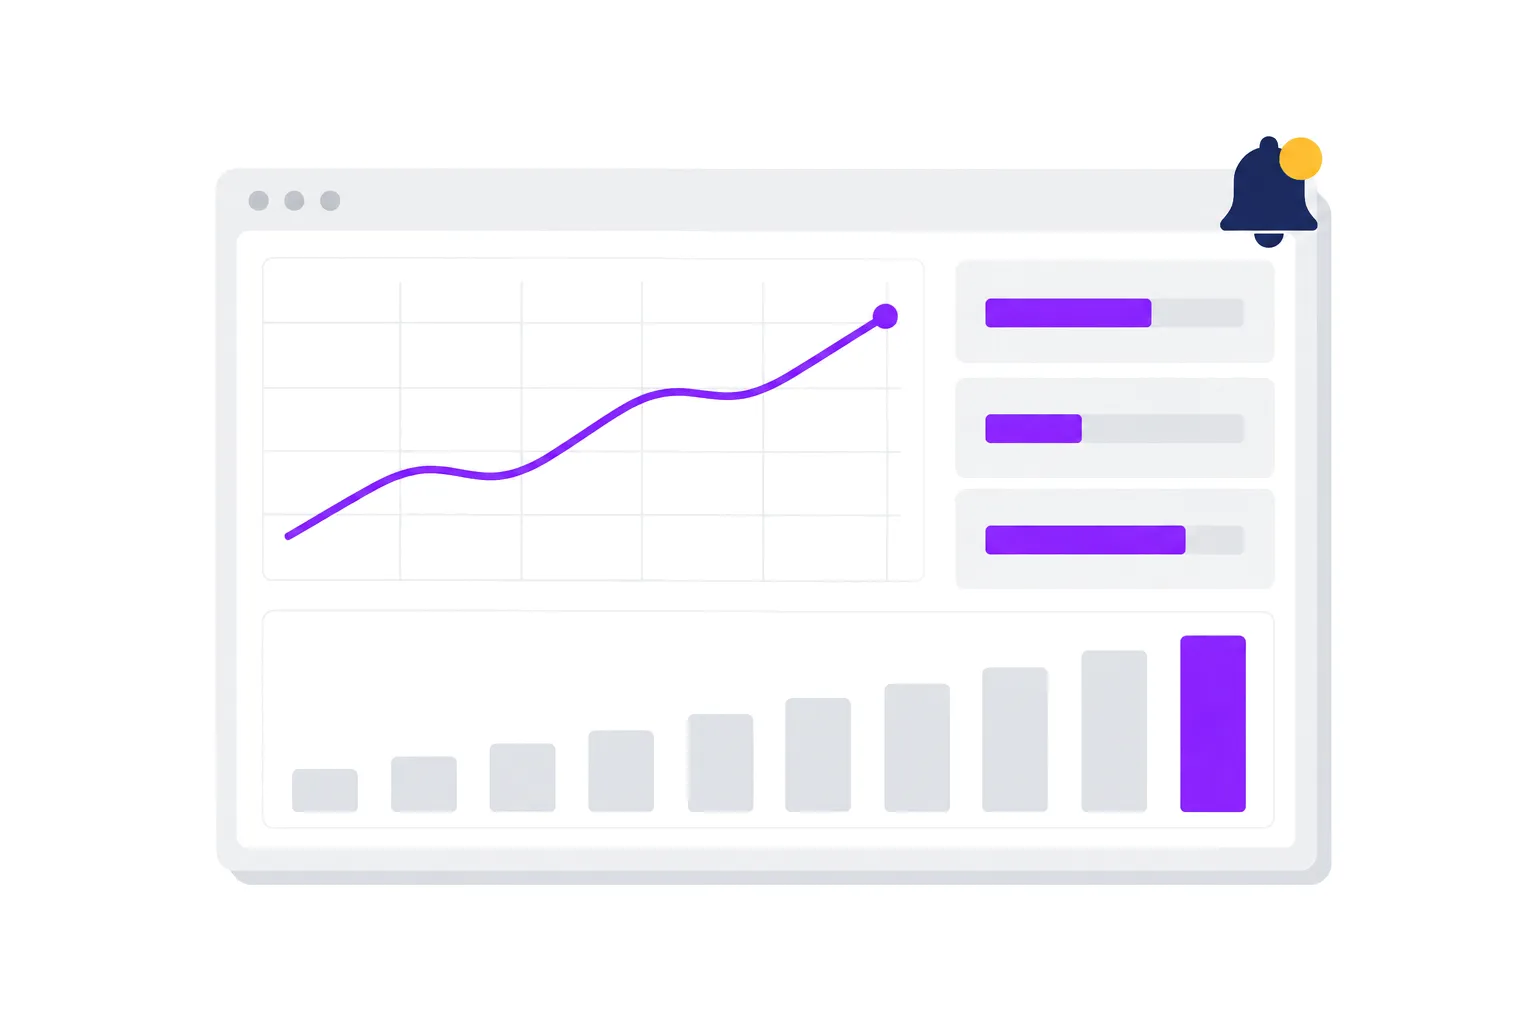
Illustration of a revenue dashboard with charts and an alert bell

Trusted by 100+ premium publishers, including

  • ynet
  • mako
  • N12
  • Israel Hayom
  • 24
  • TheMarker
  • Maariv
  • ONE

Direct integrations with the largest demand partners

  • Magnite
  • Microsoft
  • OpenX
  • Outbrain
  • Taboola
  • Criteo
  • Teads
  • TripleLift
  • Equativ
  • RTB House
  • Sovrn
  • OneTag
  • 33Across
  • and more

Why header bidding needs monitoring

Header bidding data is split by default: Prebid knows the bids, Google Ad Manager knows who won, and each SSP has its own report. The problems that cost the most never show up as an error. A partner quietly stops bidding on one site, an ads.txt line disappears, a consent change cuts bids in one country.

  • One dashboard

    Net revenue, impressions and eCPM for all your sites, by day and month, in your currency.

  • Split by format and device

    See what display, native, video and interstitials each earn, on desktop and mobile.

  • Reports by email

    Daily, weekly or monthly reports for the people who want a spreadsheet rather than a login.

  • Daily anomaly checks

    Drops in revenue or bid rate per bidder and domain are flagged every morning, ranked by cost.

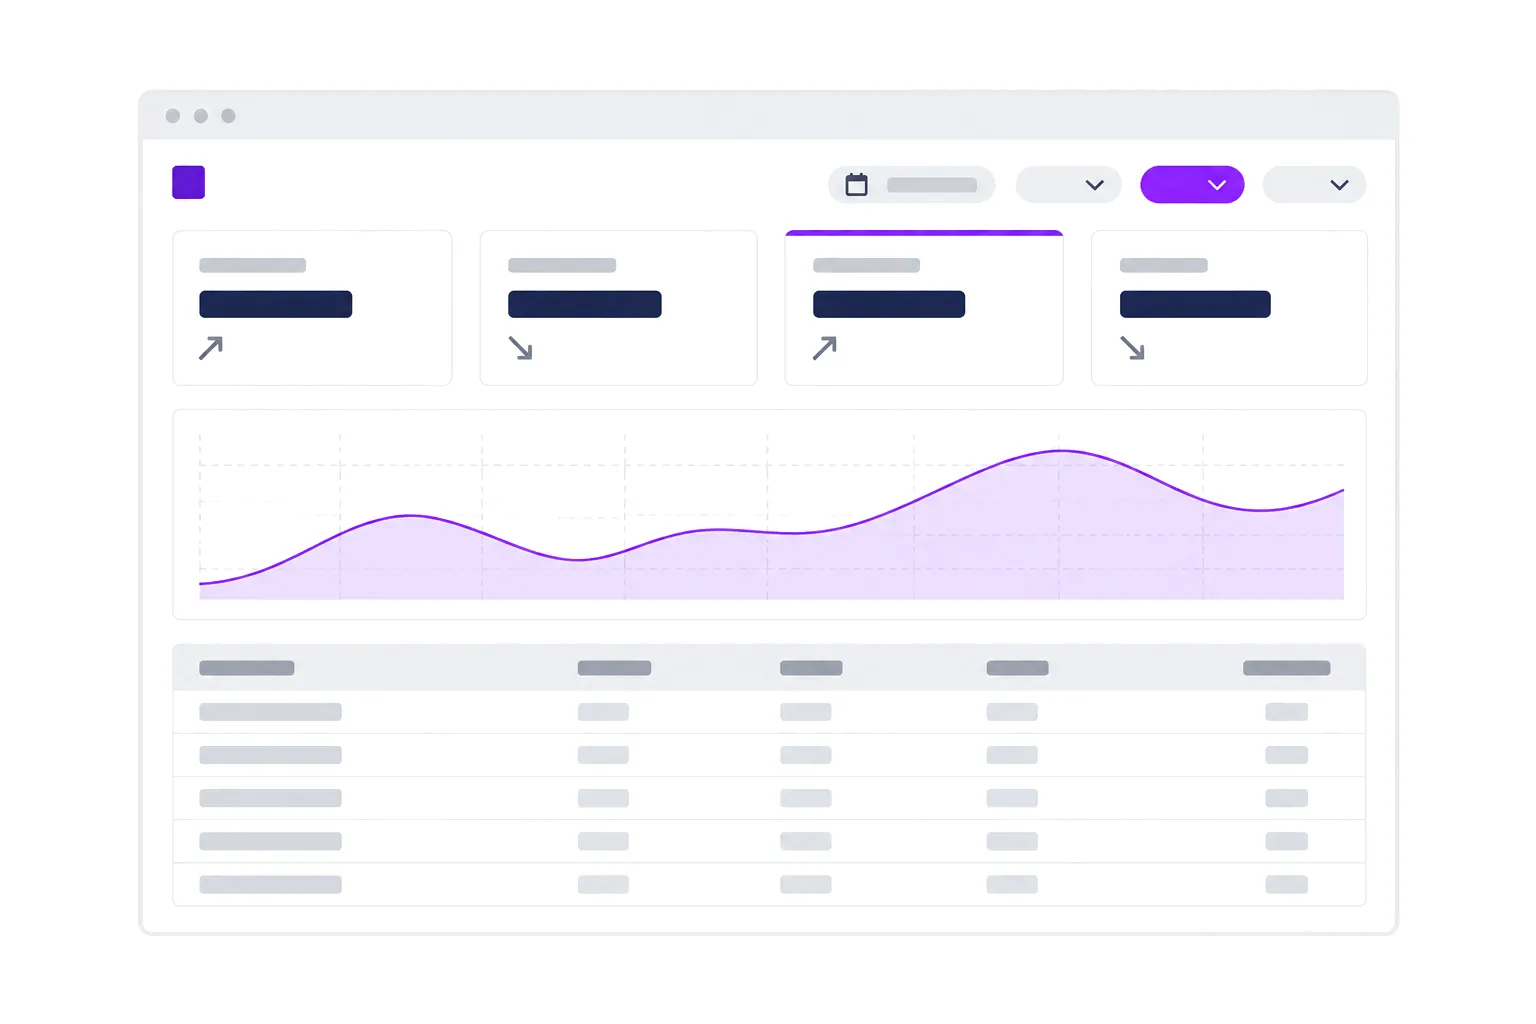
A stylized revenue dashboard with filters, metric cards, an area chart and a table

A dashboard built for publishers

Every publisher gets a login with the numbers that matter for running the business, filtered the way you think about your inventory.

  • Net revenue, impressions and eCPM, day by day and month by month
  • Filters by site, format and device
  • ads.txt health for each of your domains, with the exact lines to fix
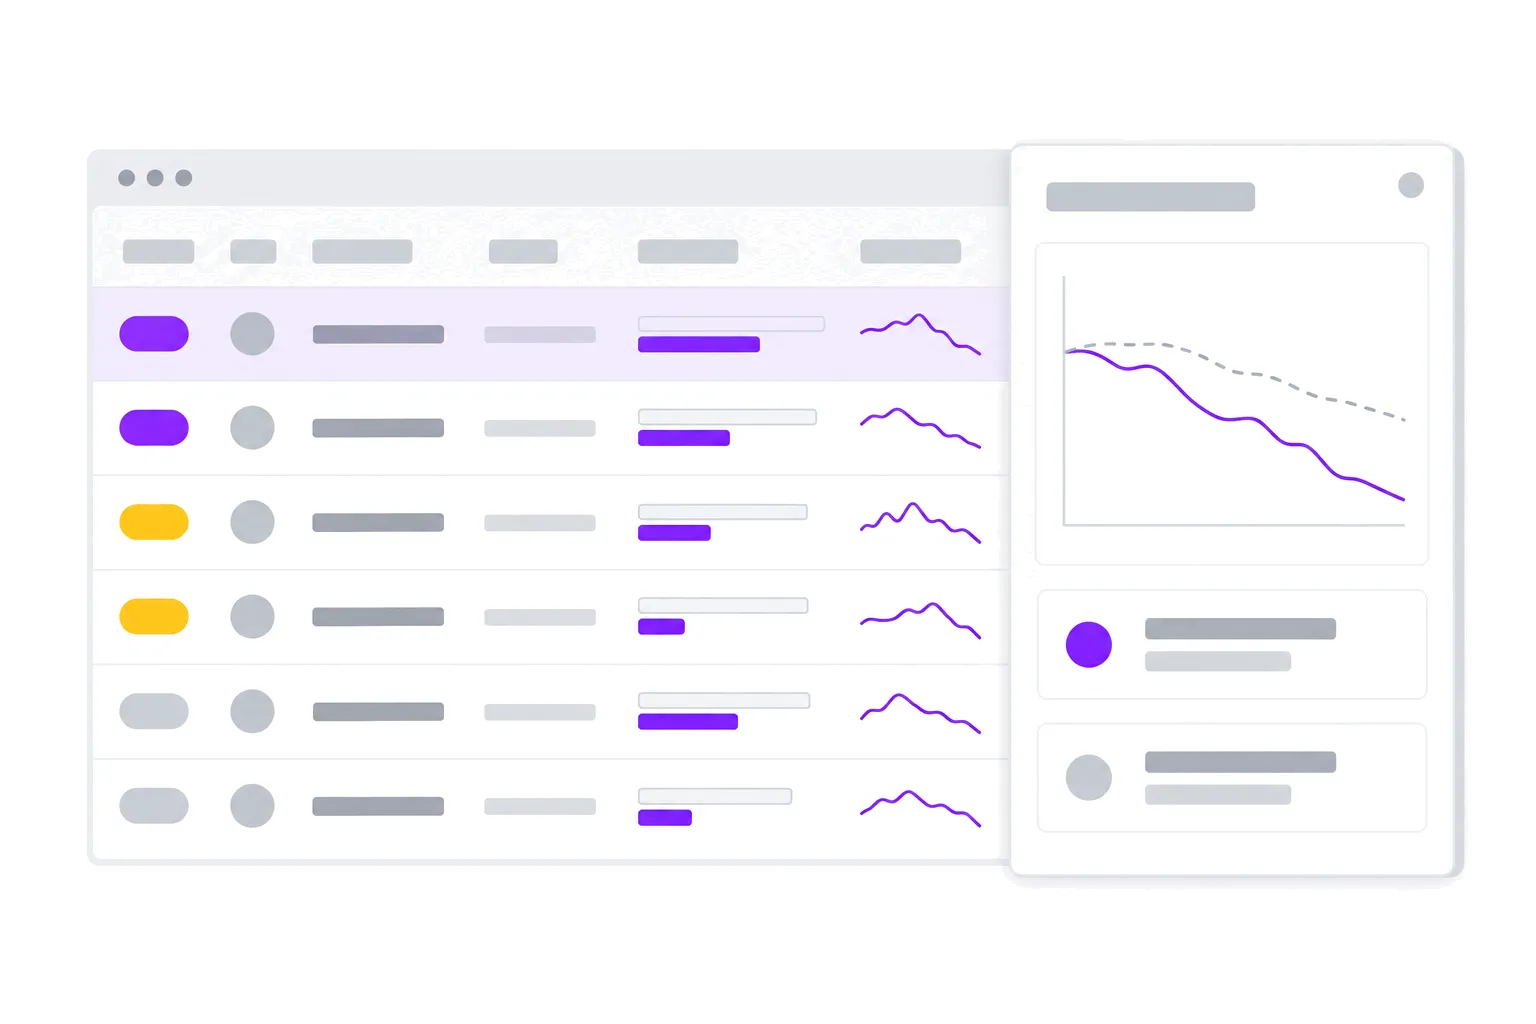
A stylized issues table with severity pills, expected versus actual bars and a detail panel with diverging lines

Problems found every morning, not at month end

Our Issues Center compares every bidder on every domain with its own recent behavior. It flags drops in revenue or bid rate and partners that stopped earning, groups issues that share a cause, and estimates the revenue at stake, so the team starts the day with the most expensive problem.

  • Bid-level metrics per bidder: bid rate, win rate, fill rate and average bid price
  • Breakdowns by site, placement, country and operating system
  • Client-side and server-side demand compared side by side

How it works

  1. 1

    Auction events are collected

    The wrapper and our Prebid Server report every auction, bid and impression as it happens.

  2. 2

    They are aggregated daily

    Events are filtered for bots and aggregated by site, format, device, bidder and more.

  3. 3

    People act on them

    You see your dashboard; our AdOps team works from the deeper view and the daily Issues Center.

Talk to an expert

After having years of experience with all kinds and sizes of agencies, developers, marketers, analysts and campaigners - I can say loud and clear that the people behind Valuad are the most brightest, enthusiasts, clever and growth drivers I have ever encountered. It's all about the people. Always.
Yaron AherDeputy CEO at The Jerusalem Post

Questions publishers ask

How often is the data updated?

Data is aggregated daily.

Is bot traffic included?

No. Bot traffic is flagged at the start of each page view and bot page views are excluded from the totals.

Can I get the data into my own BI tools?

Scheduled email reports are available to every publisher. Wrapper as a Service customers also get a reporting API with API keys.

Talk to the team behind Israel's largest publishers

Tell us about your sites and your ad server setup, and we'll show you where the revenue is.